
PTC Research · Data Study 02
Behind the Growth
What Drove Prop Trading Momentum in October 2026?
Executive summary
October's strongest measured Growth Index signals came from firms with sharply different public footprints and commercial narratives. Funded Futures Family ranked first, followed by FuturesElite, Velotrade, The 5%ers and Shark Funded. Their rankings reflect changes in branded search demand, estimated organic visibility and the public review footprint—not verified revenue, new funded accounts or payout performance.
PTC examined the October top 15, investigated five firms in depth and compared the measured signals with dated company announcements. The central finding is that there was no single model of growth. Search discoverability surged at some established firms; direct brand attention rose fastest elsewhere; several names combined more moderate increases across all three measures. Some changes may coincide with new products and aggressive promotions. Causation, however, is not established by coincidence.
Most importantly, October introduced the Growth Index v2 methodology. Its scores and places should not be treated as directly comparable with September's older calculation.
How PTC measures growth
The October Growth Index combines branded demand growth (40%), estimated organic visibility growth (35%) and public review-footprint growth (25%). The components are normalized before aggregation. Firms also require sufficient coverage and minimum input baselines. Estimated visits from Similarweb are not an index component.
Branded demand indicates searches involving a firm's name. Organic visibility is modeled search discoverability rather than confirmed website traffic. Public reviews provide an observable, imperfect activity signal; they do not represent unique customers and can be affected by collection timing. The model measures momentum in public signals, not financial or operating growth.
The October top 15
PTC's October research-score table is reproduced below. Percentages are changes in source measures used by the new index. “Not covered” means the component was not eligible or measurable, not that the firm had zero growth. Review percentages require the data-quality qualification below.
| Rank | Firm | Score | Brand demand | Organic visibility | Review footprint | Coverage |
|---|---|---|---|---|---|---|
| 1 | Funded Futures Family | 82.8 | +21.6% | +75.9% | +33.7% | 3/3 |
| 2 | FuturesElite | 77.4 | +21.7% | +53.3% | +15.8% | 3/3 |
| 3 | Velotrade | 76.6 | +18.9% | +64.4% | Not covered | 2/3 |
| 4 | The 5%ers | 76.2 | +6.8% | +112.7% | +15.4% | 3/3 |
| 5 | Shark Funded | 74.0 | +47.7% | +35.5% | +2.4% | 3/3 |
| 6 | Lucid Trading | 73.8 | +21.7% | +21.1% | +24.4% | 3/3 |
| 7 | Shark Futures | 73.4 | +27.6% | +67.1% | +1.3% | 3/3 |
| 8 | Alpha Futures | 71.4 | +0.4% | +208.2% | +7.2% | 3/3 |
| 9 | Upcomers | 70.8 | +21.3% | +29.1% | Not covered | 2/3 |
| 10 | Tradeify | 70.4 | +15.3% | +11.5% | +32.4% | 3/3 |
| 11 | Hola Prime | 70.2 | +12.8% | +14.3% | +31.0% | 3/3 |
| 12 | Traders Launch | 69.9 | +23.4% | +16.7% | +12.7% | 3/3 |
| 13 | Redline Futures Funding | 69.7 | +2.6% | +69.6% | Not covered | 2/3 |
| 14 | Vanta Trading | 69.2 | +21.4% | +23.7% | Not covered | 2/3 |
| 15 | Moneta Funded | 69.2 | +22.1% | -2.2% | +77.6% | 3/3 |
Source: PTC Growth Index v2 research scores, October 2026 snapshot. Review-footprint baselines need reconciliation; see Data quality.
Underlying September–October component change; not a change in index score.
Underlying September–October component change; not a change in index score.
Five firms, five different growth profiles
1. Funded Futures Family — broad-based momentum
The index leader combined branded-search growth of 21.6% with a 75.9% increase in estimated organic visibility. Its recorded public review count also rose in the model's source window, though the freshness of review baselines warrants caution. No single input explains its first-place result.
The firm introduced its S2F Accelerate product in September, offering a $50,000 simulated funded-account structure without a prior evaluation and promoting a substantial launch discount. Product news and price promotion are credible attention-generating mechanisms. PTC cannot identify what fraction of measured growth resulted from the launch or whether demand converted into active traders.
2. FuturesElite — product-led attention
FuturesElite ranked second with 21.7% branded-demand growth and 53.3% organic visibility growth. The firm had all three index components covered, making its performance less dependent on missing-data rules.
Its 29 July Instant Challenge update described a no-evaluation format with revised payout conditions. This is a plausible source of continuing trader interest, but the data do not establish an effect on sign-ups, profitability or retention.
3. Velotrade — visibility-led growth
Velotrade placed third with 64.4% organic visibility growth and 18.9% branded-demand growth. Its public review component was not eligible, so it qualified on two signals and 75% coverage weight rather than a complete three-input profile.
The firm published API-access and automated-trading material during 2026, providing a plausible search-discovery mechanism. The available evidence is consistent with improved content reach; it does not prove a parallel rise in paying customers.
4. The 5%ers — mature brand, fresh discoverability
The 5%ers generated 112.7% organic visibility growth—the highest among the top five—while branded demand increased a more modest 6.8%. This distinguishes improved discoverability from a sudden surge in direct brand recognition.
On 8 September the firm announced single-stock futures through The5ers Futures. Additional instrument categories and supporting education can create new search surfaces. The launch date fits the measurement window, but an attributable traffic or acquisition breakdown is unavailable.
5. Shark Funded — attention without equivalent review expansion
Shark Funded's strongest signal was a 47.7% rise in branded demand, the largest among the five leaders. Organic visibility increased 35.5%, while modeled review-footprint growth was only 2.4%. Attention and public engagement therefore did not move at the same pace.
PTC has not established a specific dated event that convincingly explains the sharp increase in branded search. It would be misleading to attribute the result to a particular campaign or to interpret it as proof of stronger credibility, payments or trader outcomes.
What changes outside the top five?
The next ten firms reveal why separate components matter. Alpha Futures (#8) recorded 208.2% organic visibility growth but only 0.4% branded-demand growth. That is a discoverability-led profile, not broad acceleration across both search measures.
Tradeify (#10) showed a more balanced profile with increases in branded demand (15.3%), organic visibility (11.5%) and recorded review footprint (32.4%). Moneta Funded (#15) moved in the opposite direction across two components: its modeled organic visibility declined 2.2% even as branded demand increased 22.2% and the recorded review footprint rose sharply. The last figure is especially sensitive to baseline freshness.
Lucid Trading, Shark Futures, Upcomers, Hola Prime, Traders Launch, Redline Futures Funding and Vanta Trading fill the remaining positions. Their presence shows a diverse growth field, including four top-15 firms with only two components covered.
The comparability and data-quality test
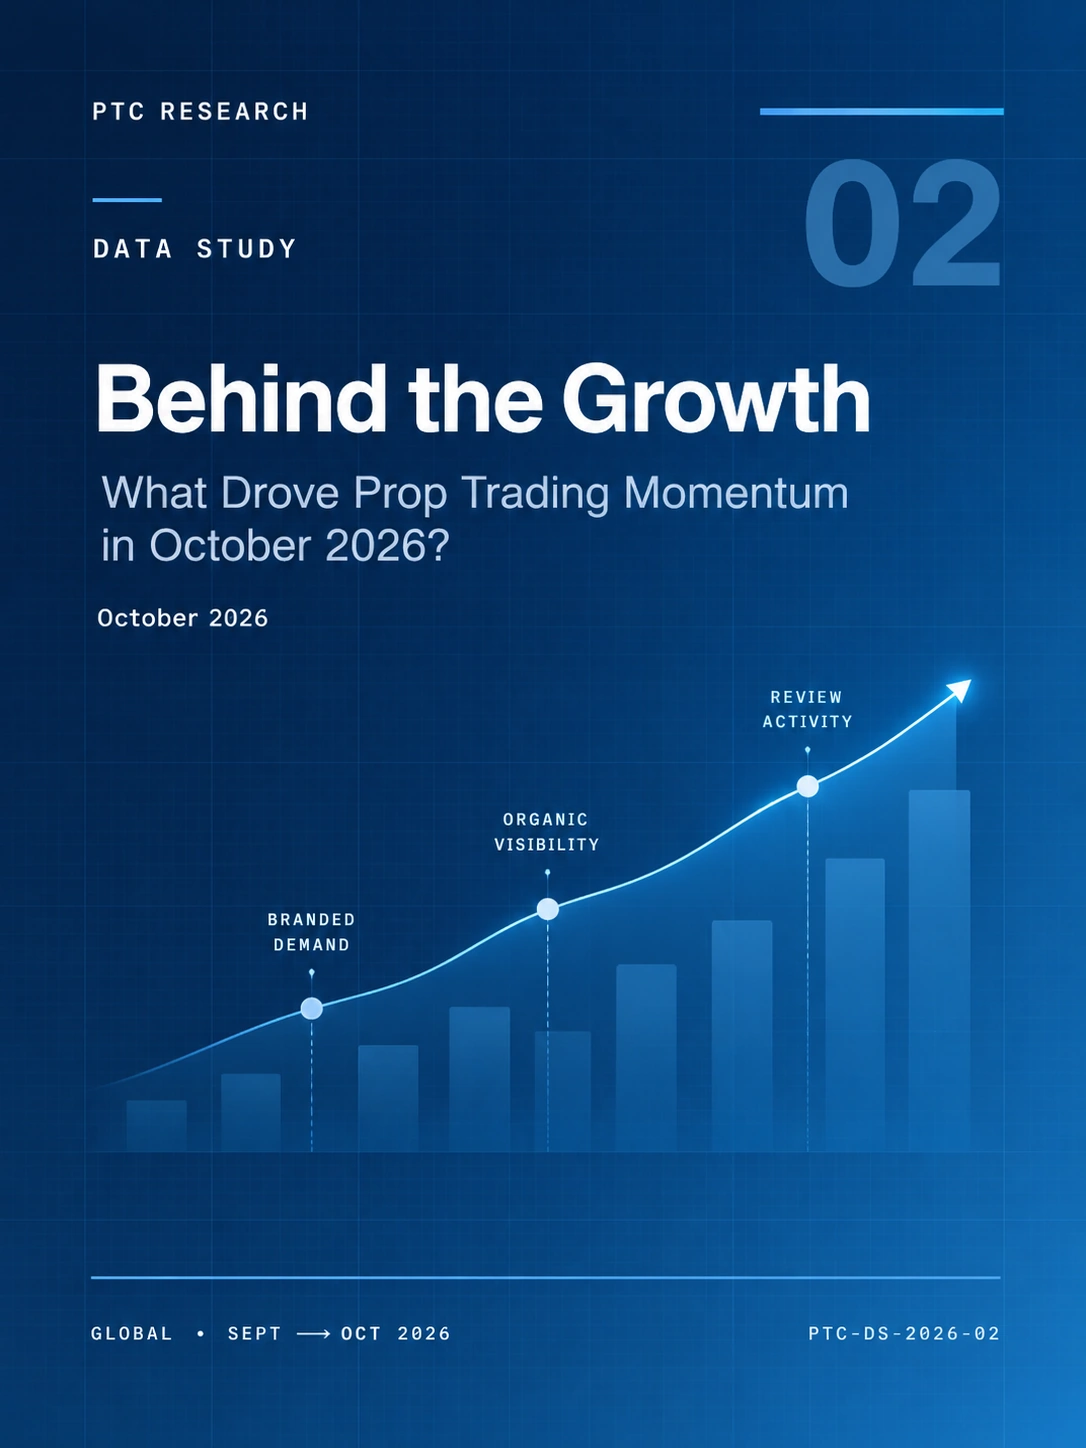
A methodological reset occurred in October. Growth Index v2 differs from September's older published methodology. The eligible set expanded from 97 to 146 firms, and changes in coverage can alter placement even without comparable underlying growth. A numerical September-to-October rank or score difference is therefore not a like-for-like performance measure. The cover's rising line is an illustration of growth signals, not a literal chart of historical index scores.
Review data are directional and subject to timing differences. In an audit of September review observations, several later-month source counts differed materially from the September 1 baseline used in the October calculation. PTC retains the published October inputs for reproducibility, but does not treat the review percentages as independently verified changes over a uniformly refreshed one-month interval. Readers should weigh branded and organic observations separately from that limitation.
Attribution has limits. Company announcements are evidence that a change occurred, not evidence that it caused a specific search metric to move. The index excludes revenue, audited trader counts, paid challenge sales and verified firm payout totals. Product or marketing developments discussed here are hypotheses about mechanisms, not causal estimates.
Conclusion — growth is not the same as leadership
October's Growth leaders did not rise through one common route. Funded Futures Family combined multiple public signals with a documented September product launch. FuturesElite paired search interest with new instant-account positioning. Velotrade and The 5%ers were particularly visible in organic search, while Shark Funded's strongest change was direct branded attention without an established explanatory catalyst.
For industry participants, the practical lesson is to examine the component mix—not simply the rank. A high Growth Index position indicates momentum in PTC's measured public indicators; it does not indicate that a firm is safer, pays more reliably or has more active funded traders. This distinction is essential to comparing newer challengers with firms that lead PTC's Power or Market Presence measures.
Sources and methodology
Quantitative source: PTC October 2026 Growth Index v2 research scores, snapshot month 1 October 2026, source cutoff 4 October 2026. Model weights: branded demand 40%, organic visibility 35%, public review footprint 25%. Percentages in the table reproduce the published model inputs.
- FFF: S2F Accelerate product guide (16 September 2026)
- FuturesElite: revised Instant Challenge rules (29 July 2026)
- The 5%ers: September single-stock futures launch
- Velotrade: May API-access announcement
Company publications are primary sources for their own product statements, not independent evidence of performance. PTC's methodology and uncertainty disclosures govern interpretation of all estimated indicators.